The competitor analysis section enables users to compare the data of a brand with that of its competitors, providing the capability to compare different competitors beyond the specified brand.
*TO DRILL DOWN INTO THE POSTS, YOU CAN SIMPLY CLICK ON ANY SECTION OF ALL AVAILABLE VIEWS TO BRING UP THE ASSOCIATED POSTS.*
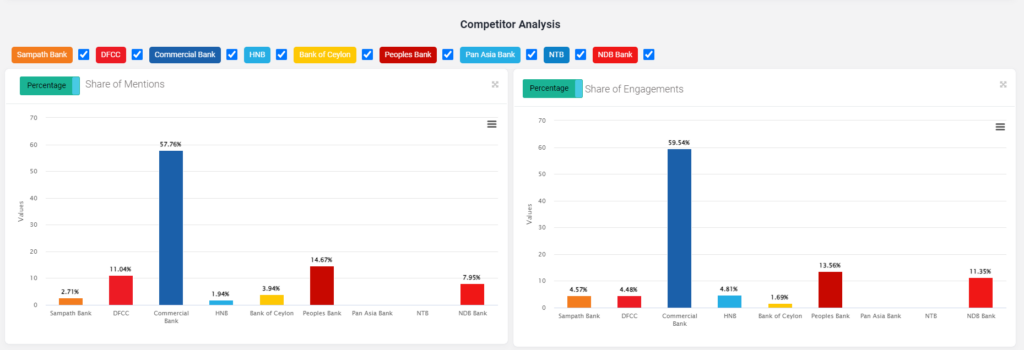
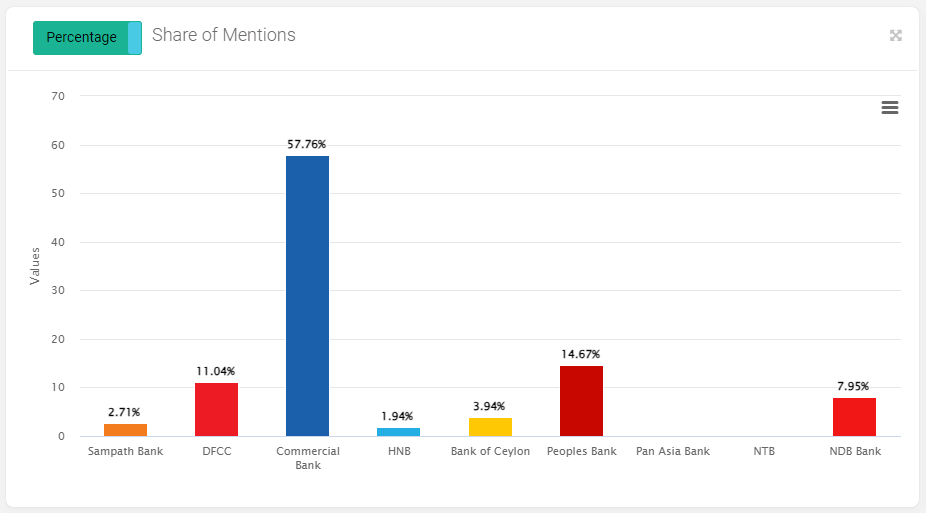
Share of Mentions
This chart displays the distribution of mentions between competitors and the brand across diverse social media channels. Users can choose to view the data in both percentage and count formats.
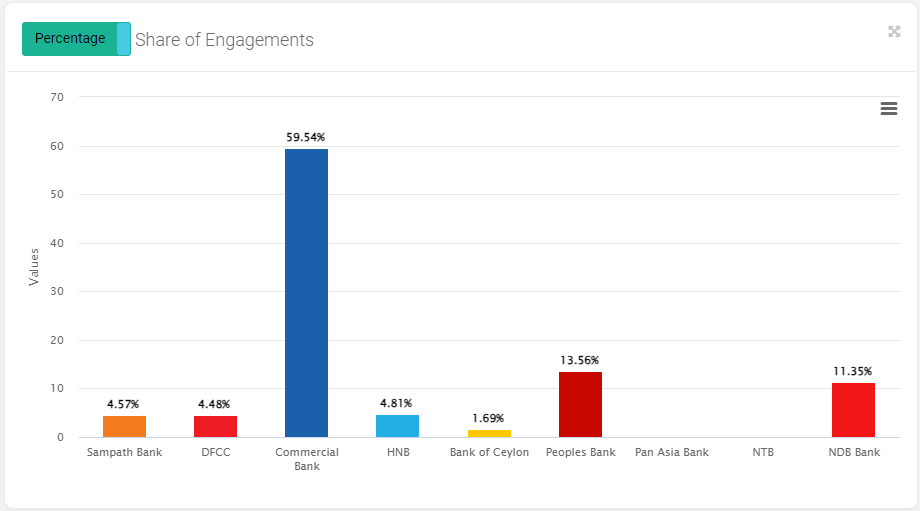
Share of Engagement
This chart illustrates the engagement of competitors and the brand across social media channels. Users can choose to view the data in either percentage or count formats.
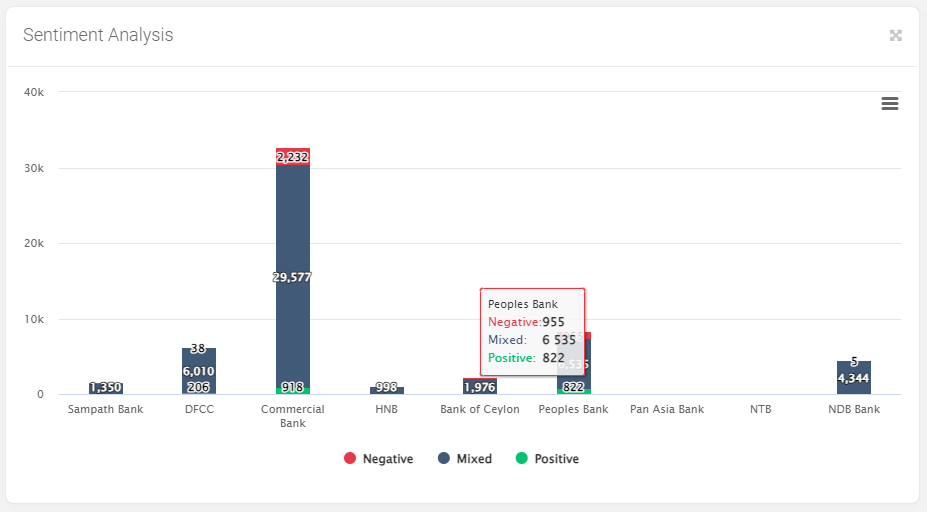
Sentiment Analysis
This indicates the sentiment analysis results for both the competitor and the brand on social media platforms. Clicking on the sentiment at the bottom of the chart allows you to explore the relevant data specific to the chosen sentiment category.
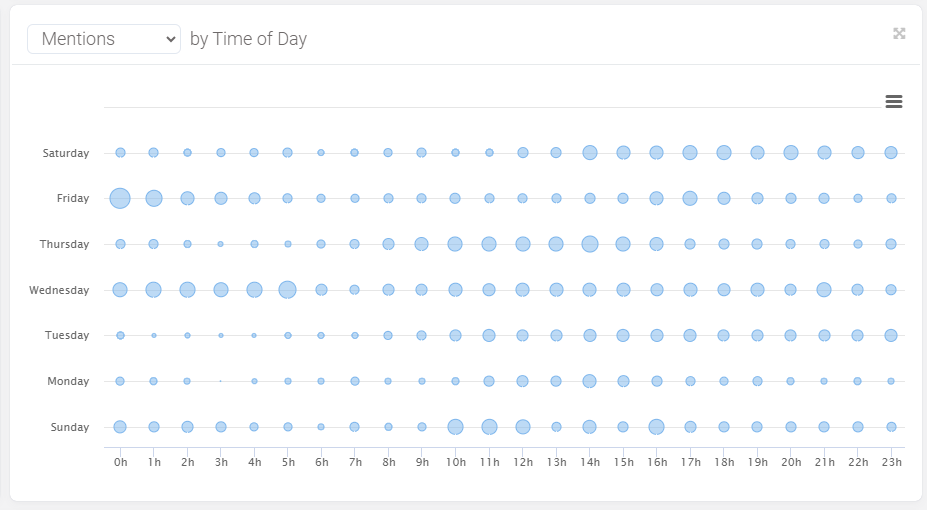
Mention | Engagement | Social Reach by Time of Day
This graph shows how mentions, engagements, and social reach for competitor brands change throughout the day.
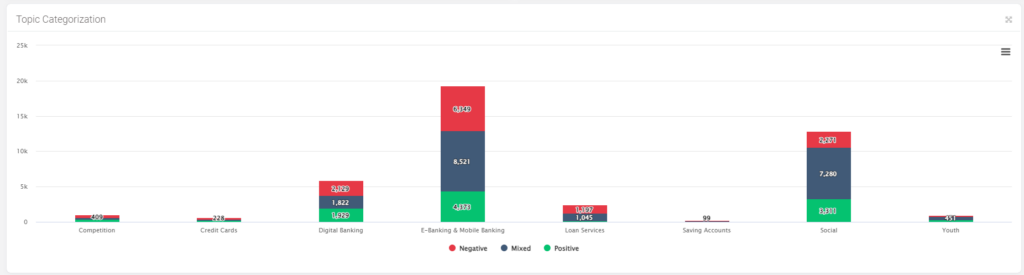
Topic Categorization
This chart depicts the sentiment of social media content for competitor brands based on predefined categories. Clicking on sentiment at the bottom of the chart enables you to explore specific and relevant data related to the chosen sentiment category.
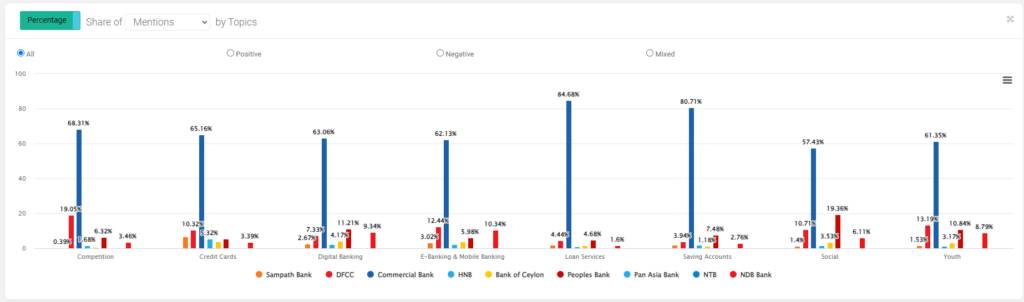
Share of Mentions | Engagements by Topics
This chart visually depicts mentions and engagement for both the brand and competitor based on the predefined categories.
Clicking on the brand or competitor at the bottom of the chart allows access to specific data related to the selected brand.
Furthermore, you can choose a sentiment to view corresponding sentiment data. Users can choose to view the data in both percentage and count formats.
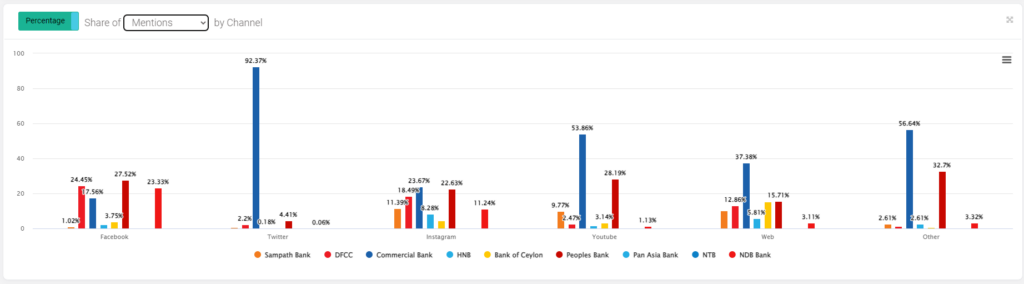
Share of Mentions | Engagements by Channel
This chart visually depicts mentions and engagement for both the brand and competitor across various social media channels.
Clicking on the brand or competitor at the bottom of the chart allows access to specific data related to the selected brand. Users can choose to view the data in both percentage and count formats.
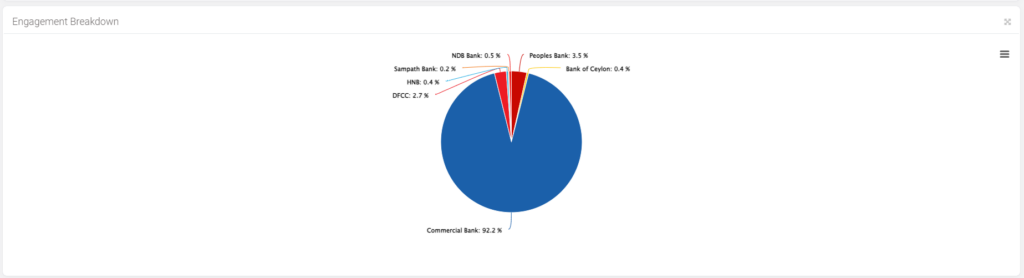
Engagement Breakdown
This chart depicts the competitors’ social media engagement through a pie chart.
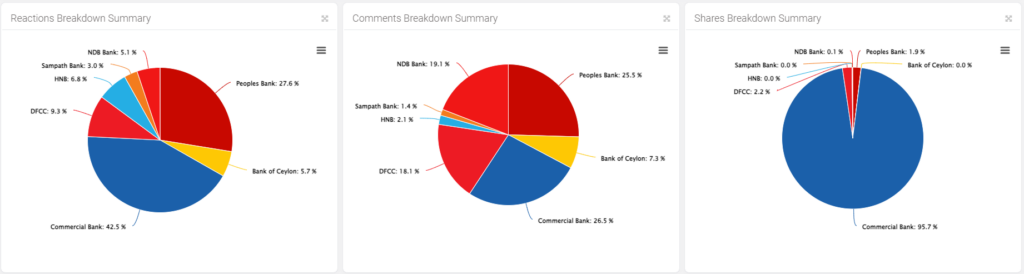
Reactions | Comments | Shares Breakdown Summary
These pie charts illustrate how reactions, comments, and shares are distributed among competitor brands for their social media posts.
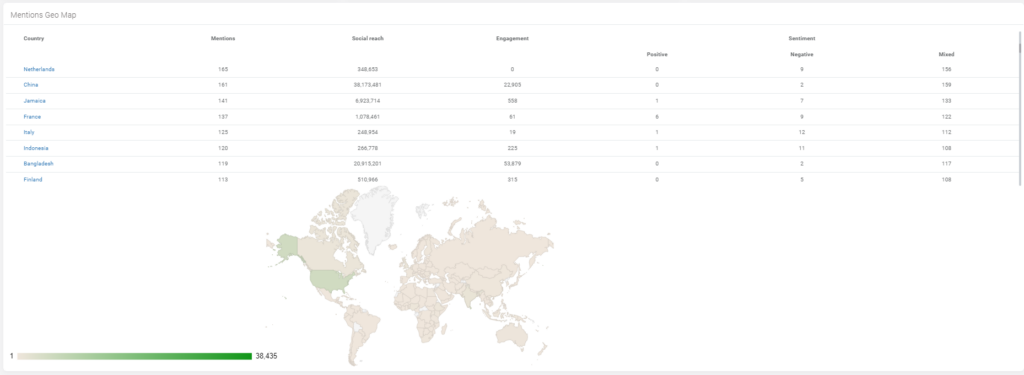
Mention Geo Map
Mention Geo map displaced the global distribution of competitor brand mentions.
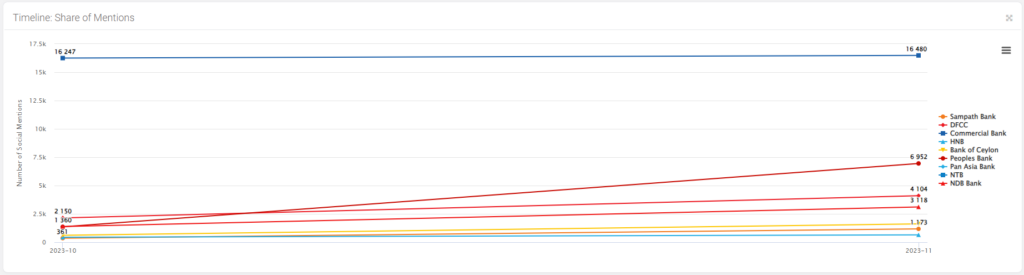
Timeline Share of Mentions
This illustrates the variations in mentions of competitor brands over time. Clicking on the respective competitor brand names allows you to view data specific to each one.
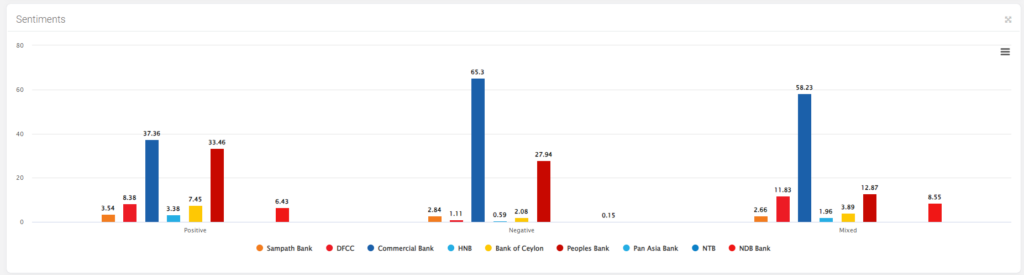
Sentiments
This chart showcases the social media sentiment for competitor brands. Clicking on the respective competitor brand names allows you to view data specific to each one.
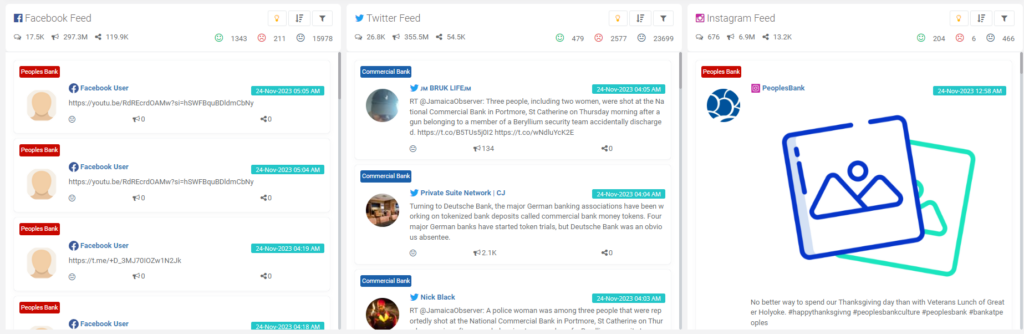
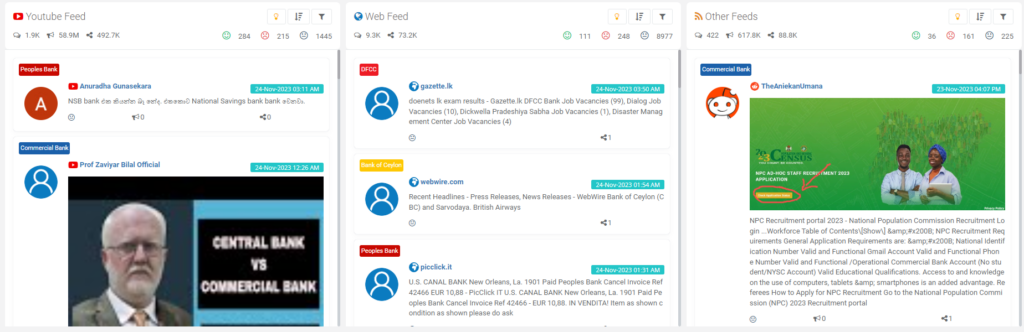
Social Media Feeds
This visualizes the publicly shared social media posts for competitor brands.
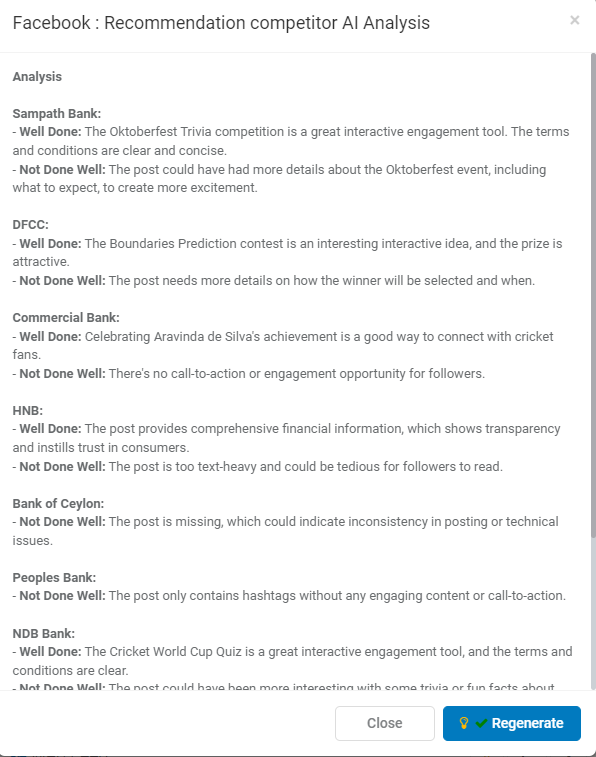
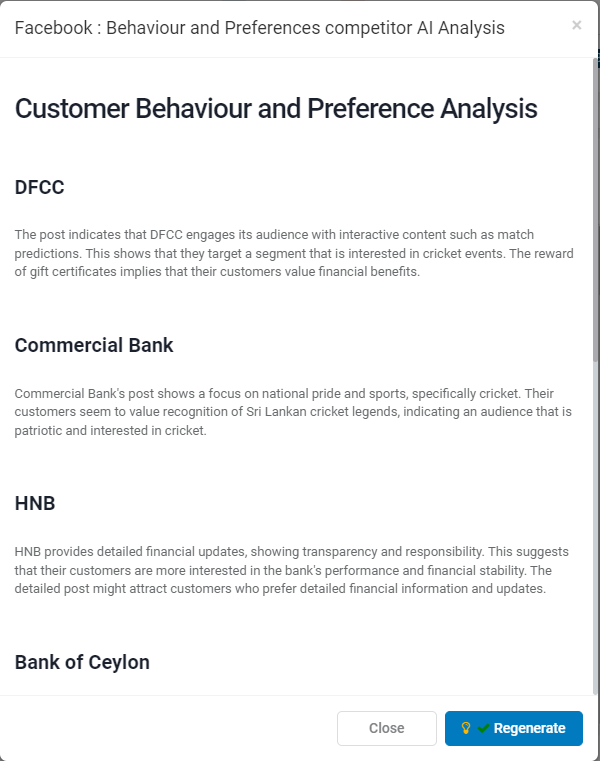
- AI Analysis:
- Recommendations: Upon clicking on recommendations you can receive recommendations based on social feed analysis
- Behavior and Preferences: by clicking on the behavior and preferences option the AI will analyze audience behavior and preferences empowering you to create a more engaging social media presence.
- Sort: Clicking on the “sort” option allows you to organize the feed content based on criteria such as latest, engagement, and reach.
- Competitors: By clicking on the “Competitors” button, you can select the relevant brand and competitor brands to view the associated data.
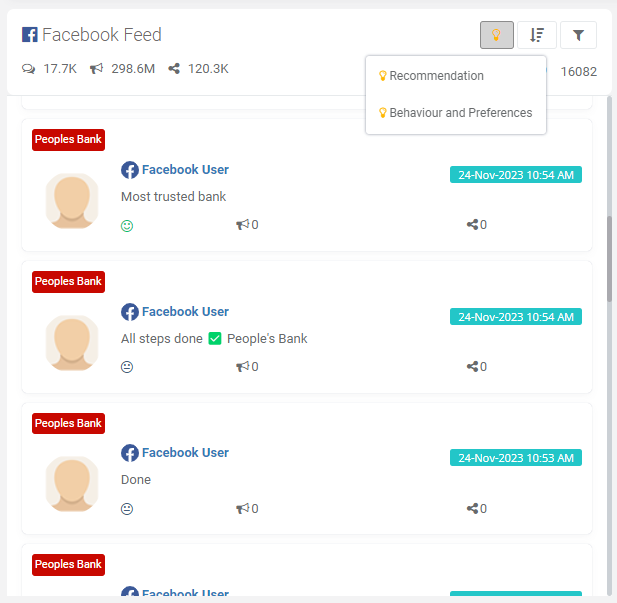
Clicking on the “sort” option allows you to organize the feed content based on criteria such as latest, engagement, and reach. Additionally, by clicking on the “competitor” button, you can select the relevant brand and competitor brands to view the associated data.