SLT Brand analyses are a crucial aspect, providing a comprehensive overview of the brand. Let’s dive into each analytics feature in detail.
Total Mention | Engagement | Social Reach Timeline
*TO DRILL DOWN INTO THE POSTS, YOU CAN SIMPLY CLICK ON ANY SECTION OF ALL AVAILABLE VIEWS TO BRING UP THE ASSOCIATED POSTS.*
This chart visually represents the fluctuation of mentions, engagement, and social reach over a specified time period, providing a comprehensive overview of the brand’s online presence and audience interactions.
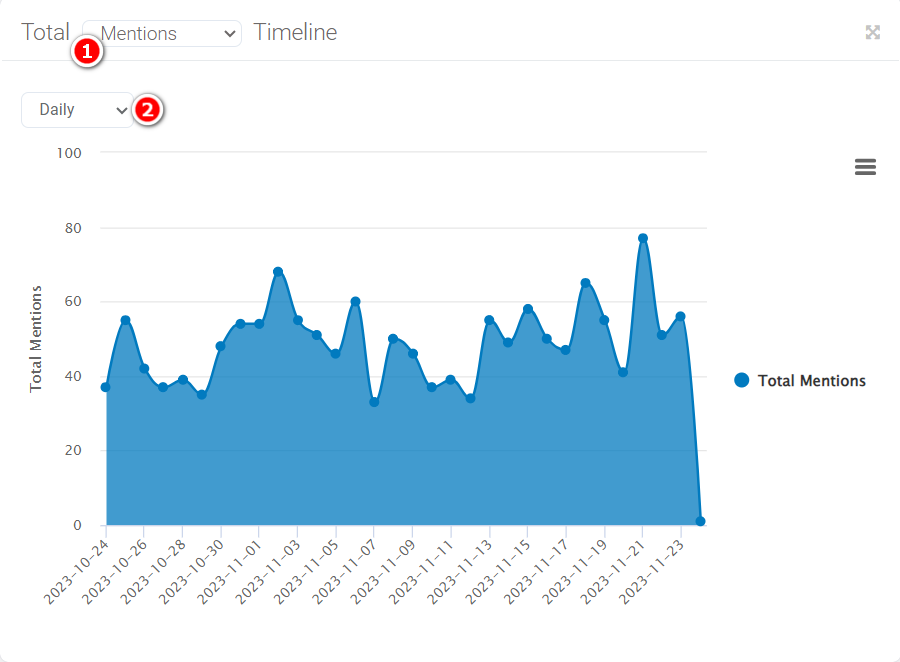
- Metric dropdown: Choose between “Mention,” “Engagement,” or “Social Reach” metrics.
- Select a time frame: “Daily,” “Monthly,” or “Yearly” for different timeline perspectives.
Brand Mentions Timeline
This displays a representation of brand mentions, offering insights into the frequency and trends of online discussions related to your brand over a specified time period.
You can further drill down on each mention to a specific date by clicking on its corresponding point.
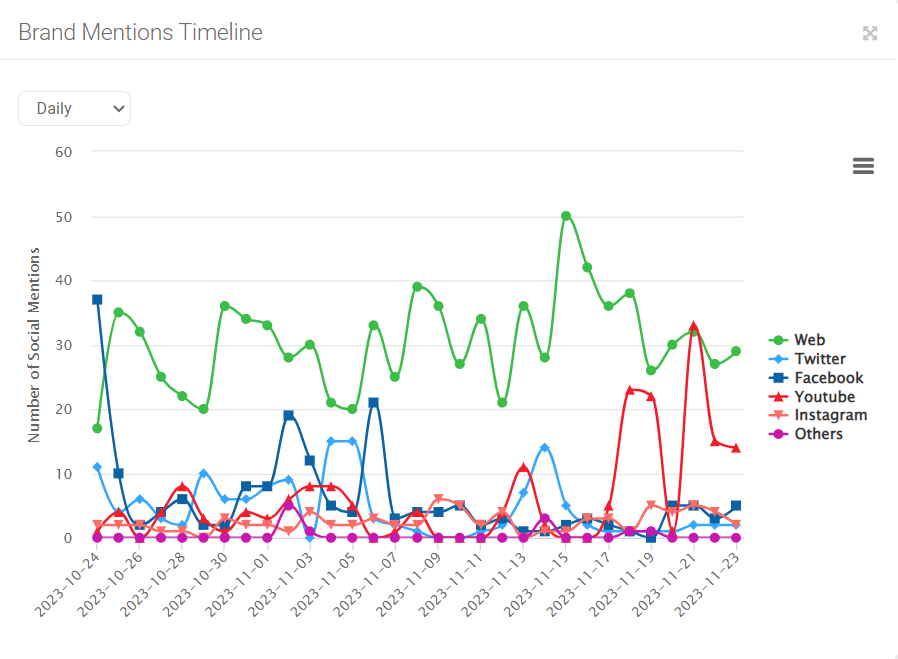
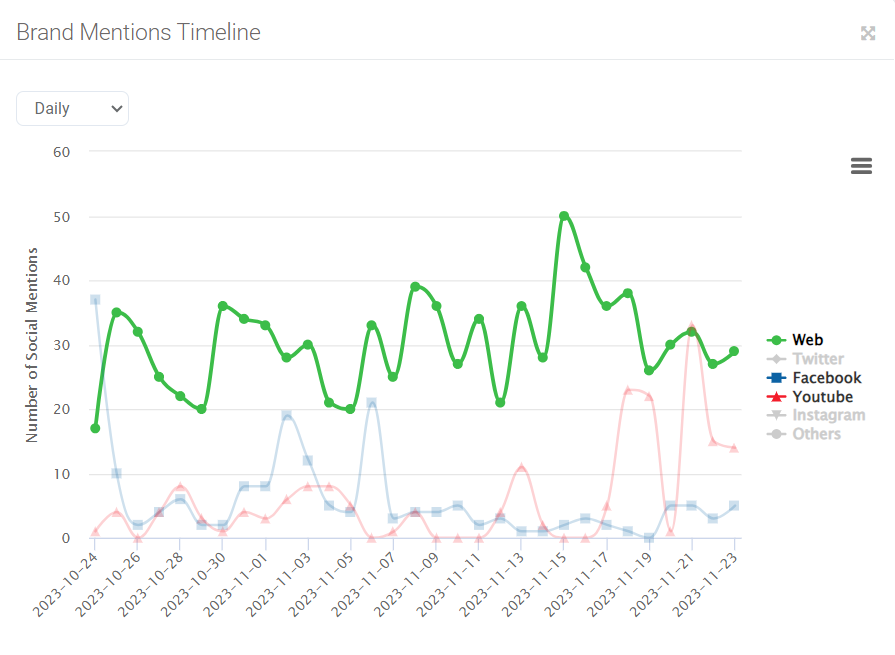
Simply click on the legend you can easily switch between different channels and view the corresponding timeline.
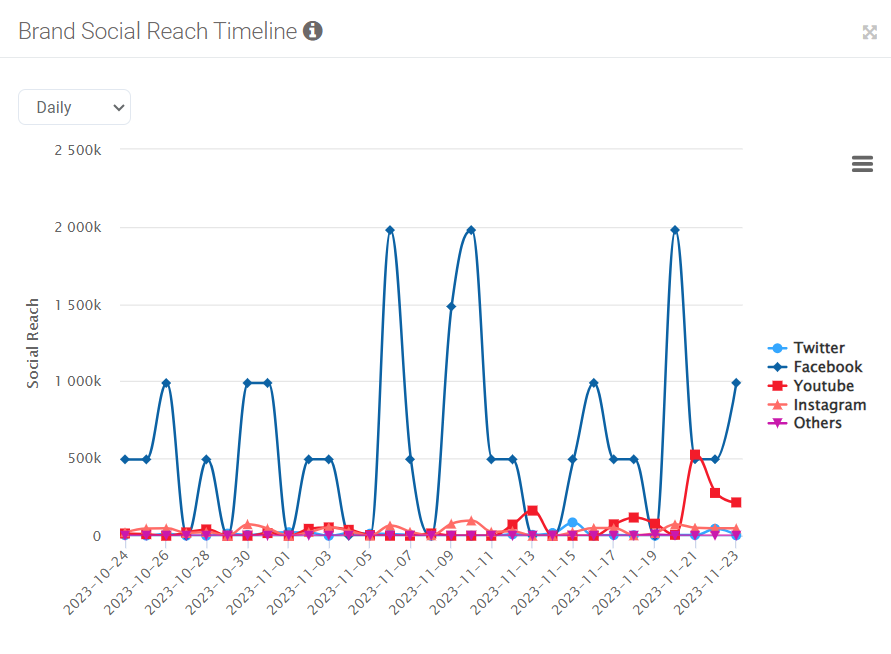
Brand Social Reach Timeline
The social reach timeline reveals the social media channels utilized by engaged viewers over time. It provides insights into the platforms where your brand holds a strong presence enabling you to concentrate your marketing efforts strategically.
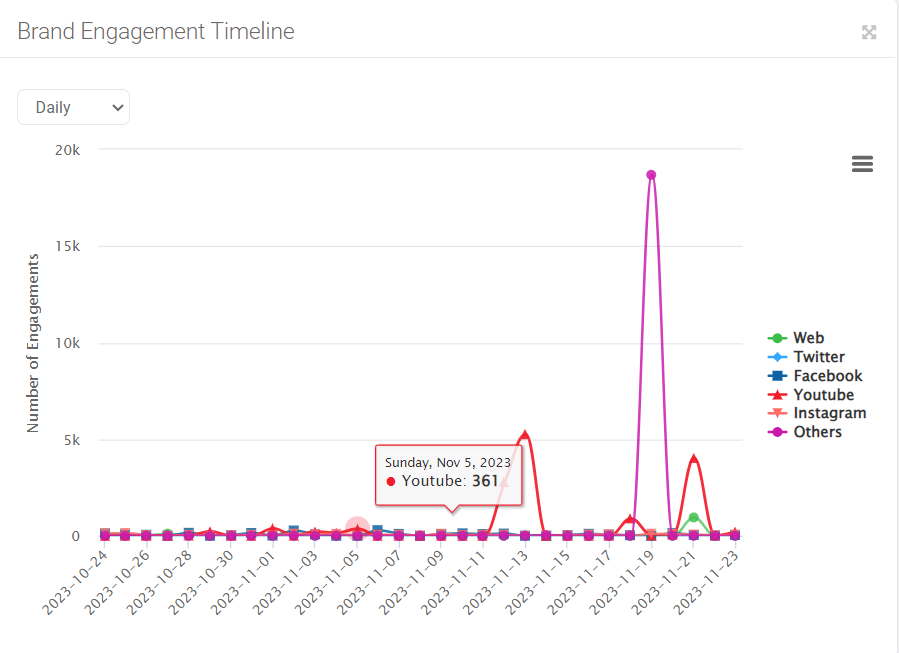
Brand Engagement Timeline
The brand engagement timeline graph displays how people interacted with your brand over time including likes and comments, It helps track engagement Trends and measure the impact of your brand on social media platforms
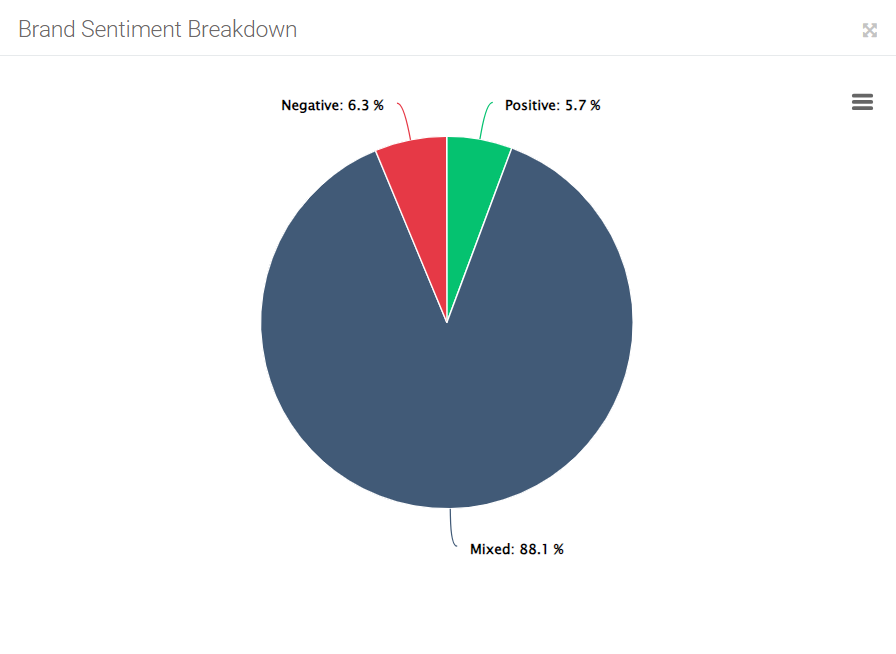
Brand Sentiment Breakdown
The Brand Sentiment Breakdown chart provides a concise visual representation of the distribution of sentiments surrounding your brand, categorizing them into positive, negative, and mixed sentiments for a comprehensive overview.
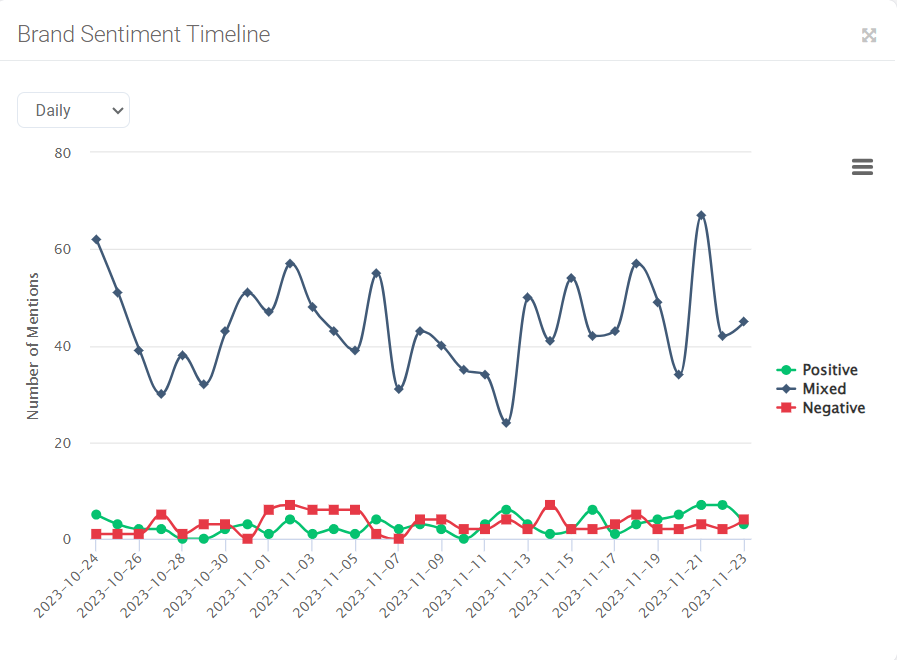
Brand Sentiment Timeline
The brand sentiment timeline graph provides an overview of the sentiment expressed in the content shared across social media channels over time. by referring to this graph you can easily assess the prevailing sentiment associated with your brand.
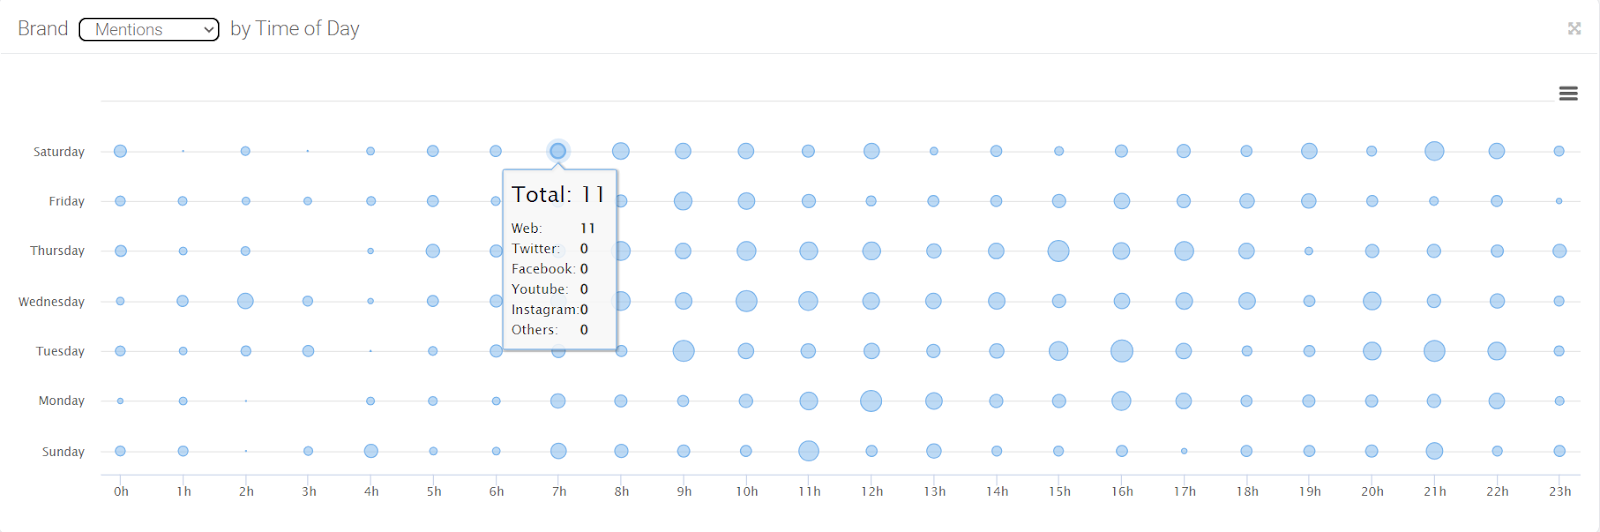
Brand Mentions | Engagement | Social Reach by Time of Day
This graph visualizes brand mentions, engagement, and social reach throughout the day. Use the dropdown menu to switch between views, hover over bubbles for additional information, and click on a bubble to access social media posts associated with that specific time.
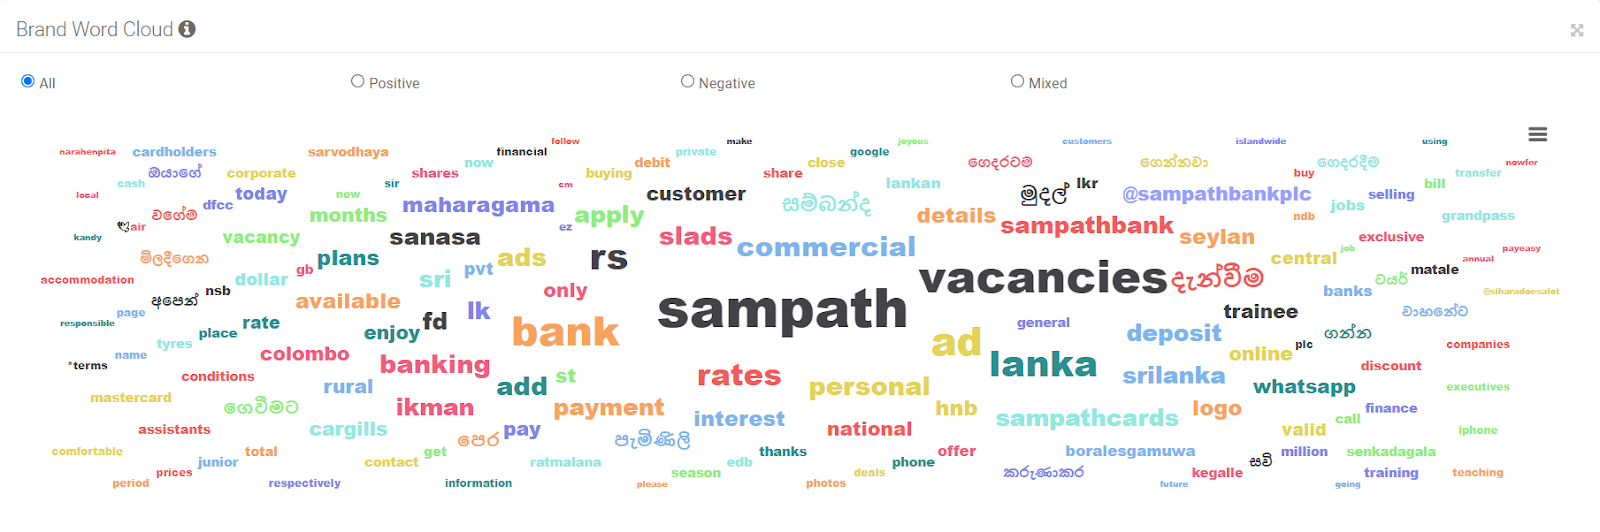
Brand Word Cloud
Brand word cloud displays common words when mentioning your brand. Click on a word to access social media posts associated with that specific word.
To generate the word cloud only for a particular sentiment, select the sentiment (Positive, Negative, Mixed)
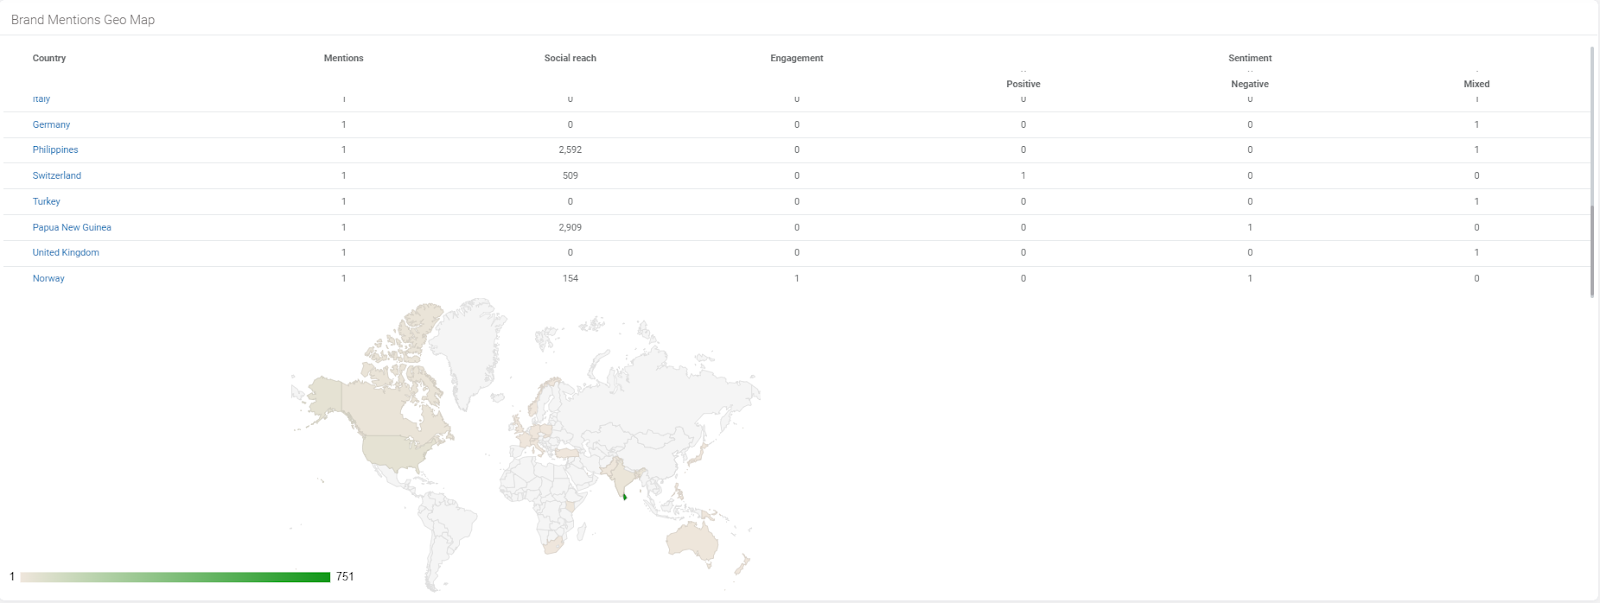
Brand Mentions Geo Map
The Brand Mention Geo Map visualizes social media traffic locations. Click on a country in the table or map to access a detailed view of the brand’s posts specifically related to that country.
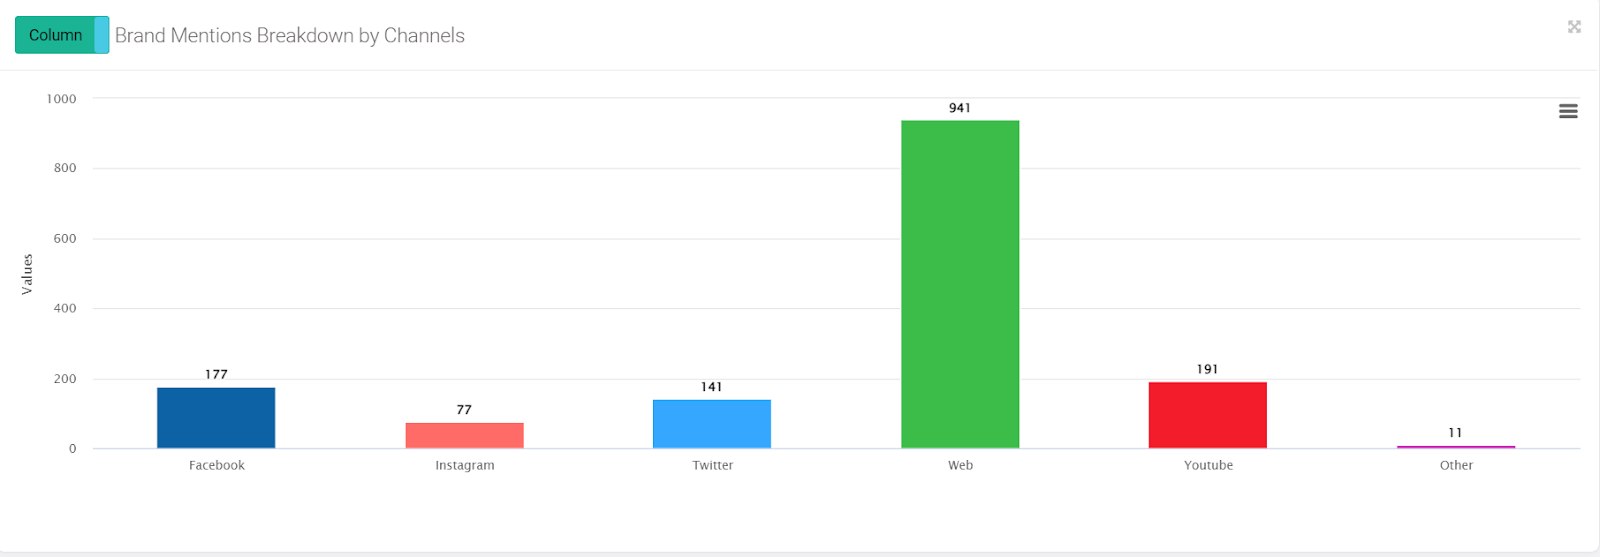
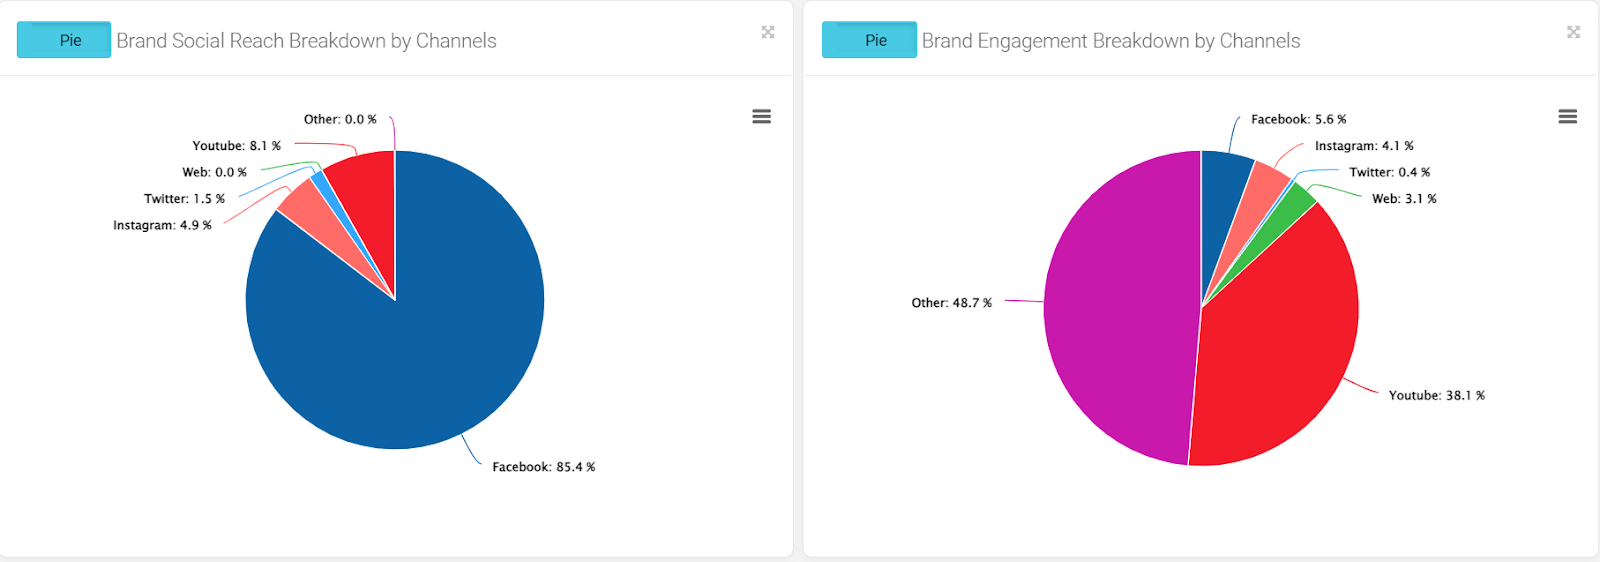
Brand Mentions, Social Reach and Engagement Breakdown by Channels
The Brand Mentions/Engagement/Social Reach Breakdown by Channels charts display brand mentions, social reach, and engagement categorized by channels. Toggle between pie or column charts, and click on any section to explore posts related to the respective channel.
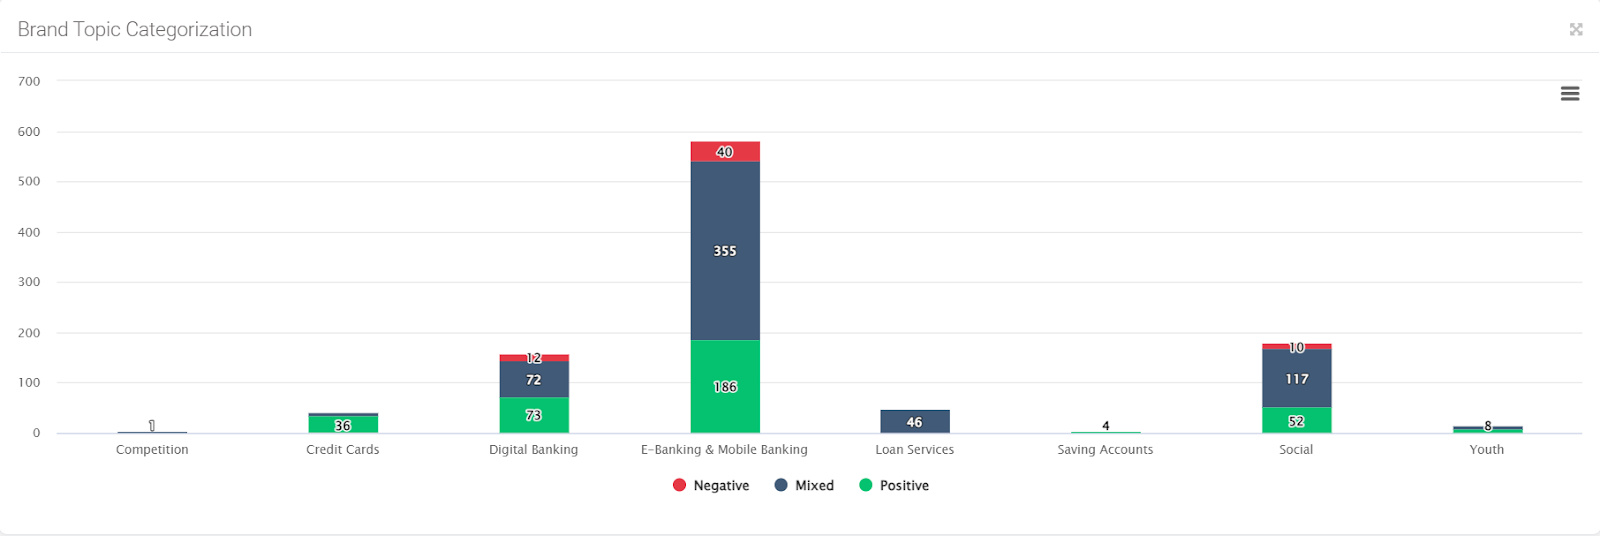
Brand Topic Categorization
The brand topic categorization graph illustrates brand sentiment across predefined categories helping identify brand shortcomings and areas for improvement.
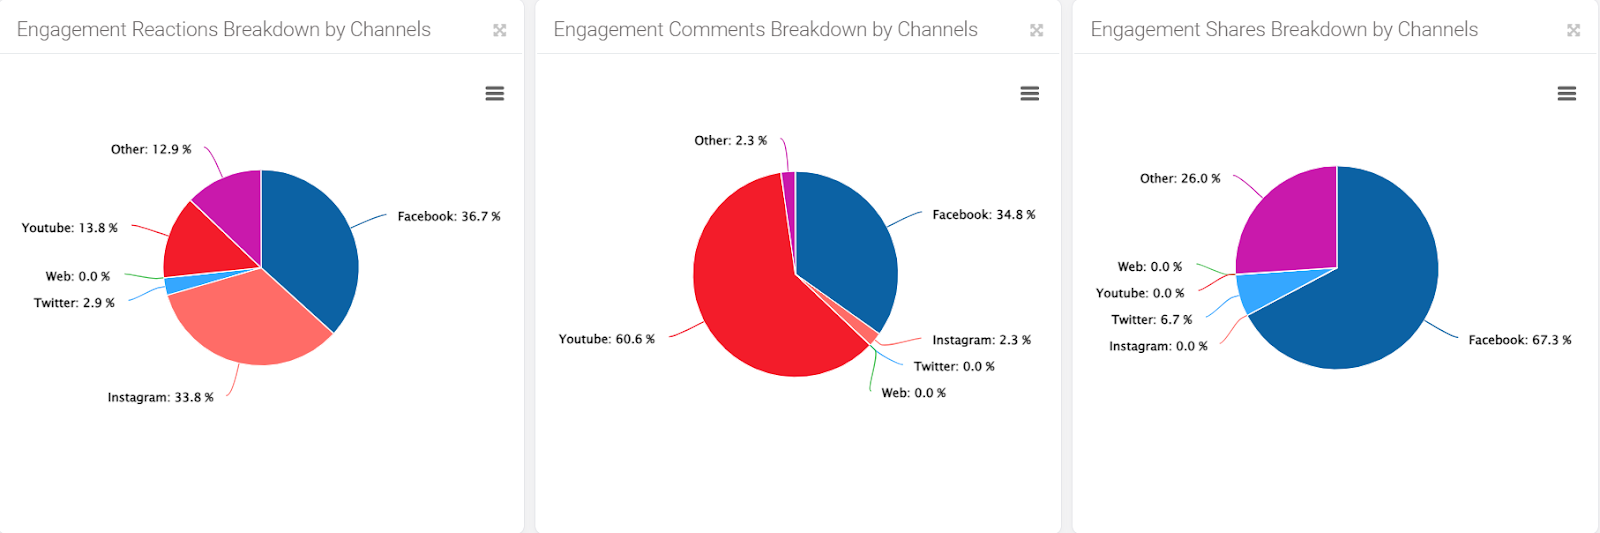
Engagement Reactions, Comments, and Shares Breakdown by Channels
The Engagement Reactions, Comments, and Shares Breakdown by Channels charts illustrate the distribution of engagement components (reactions, comments, shares) across various channels. Click on any section to view posts associated with the specific channel.
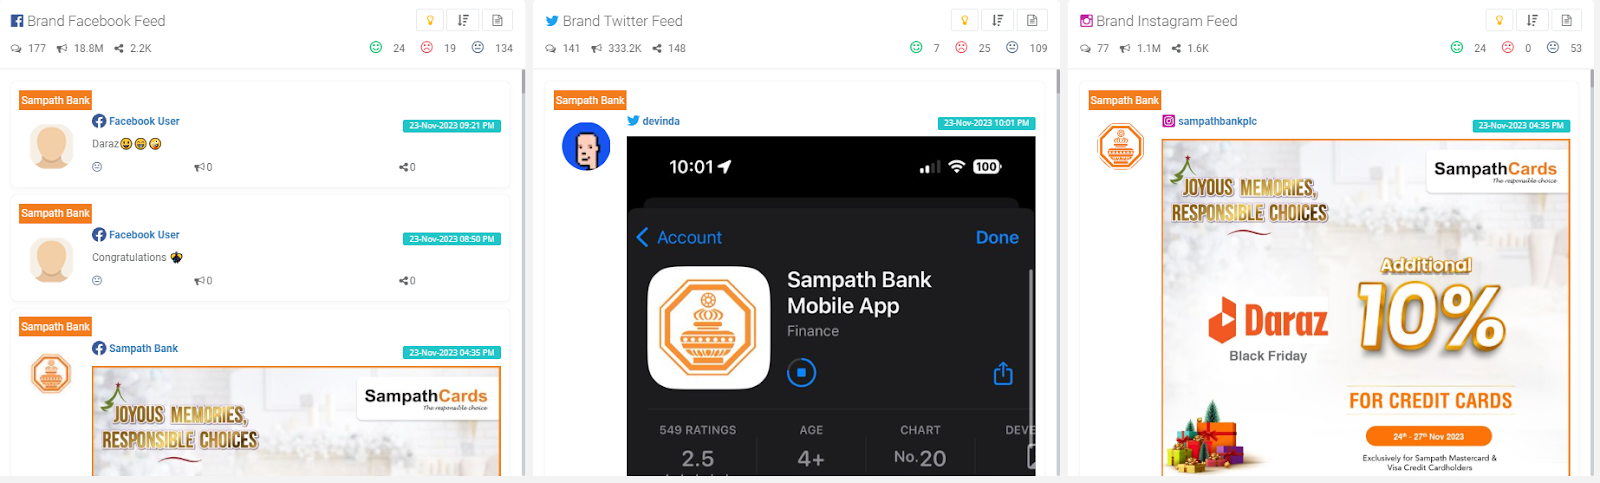
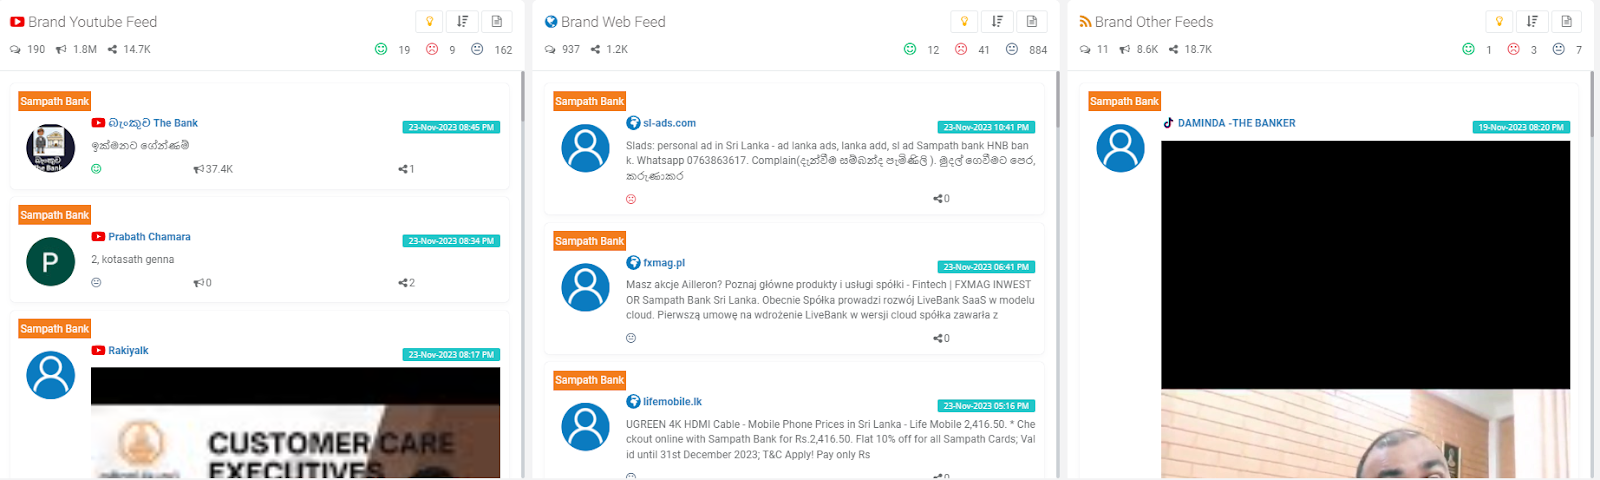
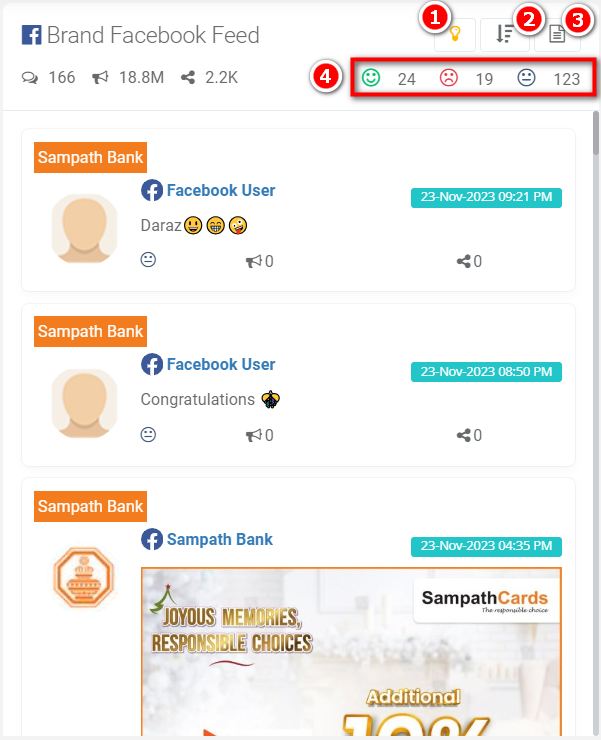
Social Media Feed
The social media feed view aggregates publicly available posts for the brand across popular social media channels such as Facebook, Twitter, and many others. This shows the overall sentiment of each post per channel
- AI Analysis
- Recommendations: Upon clicking on recommendations you can receive recommendations based on social feed analysis
- Behavior and Preferences: by clicking on the behavior and preferences option the AI will analyze audience behavior and preferences empowering you to create a more engaging social media presence.
- Sort: Clicking on the “Sort” option allows you to arrange posts in the feed based on the latest, engagement, or reach criteria.
- Filter Ticket: Clicking on the “Filter Ticket” option enables you to filter only the posts that have tickets created.
- Sentiment: Clicking on the relevant sentiment icon allows you to filter posts specifically related to that sentiment.
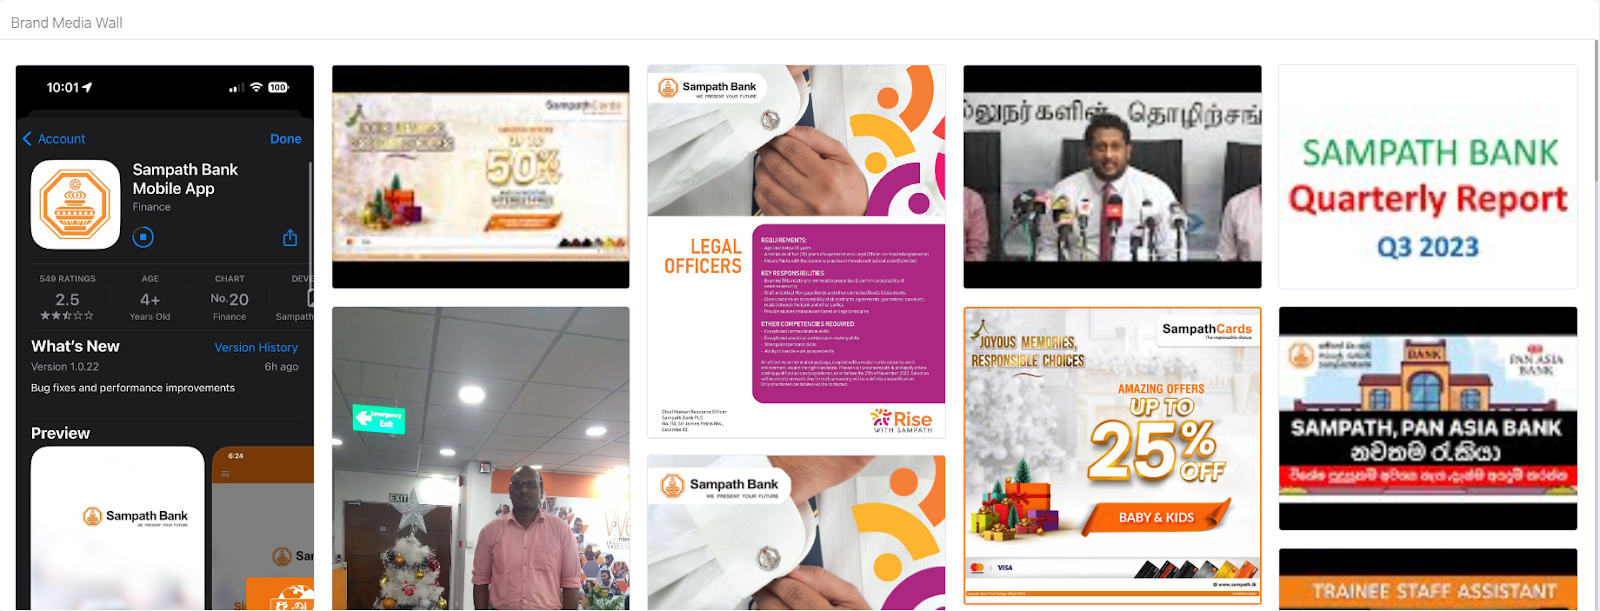
Brand Media Wall
This provides an aggregated view of publicly available media in the form of a media wall. It allows you to easily monitor and view what is being shared about your brand on social media. Clicking on an image redirects you to the original post for further exploration.